
Subtype of an analysis
Depending on the type of analysis, you can choose between different Analysis types and Subtypes in the first step of the analysis wizard.
The selection between different analysis types is available for the following analyses:
Region Bound Display
What is included in the classification?
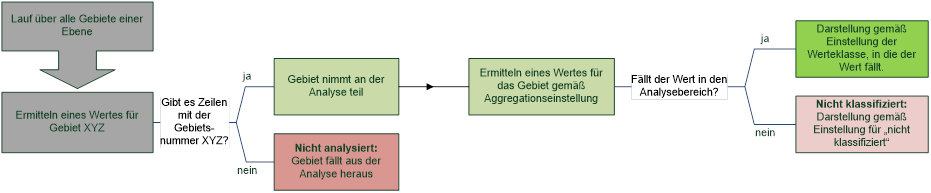
For area based analyses, there is a difference between not analyzed and not classified.
If there is no data at all for an area, i. e. no row of the table corresponds to the number of the respective area , this area does not participate at all in the analysis. The area remains uncolored during surface coloring, and no symbol or diagram is generated for symbol or diagram analysis.
However, if at least one row is found in the table whose number matches the area, this area is included in the analysis. The classification now determines what is displayed for this area. If there is no value in the column used for the analysis or if it is outside the analysis area, this value falls into the remaining class not classified. However, unlike areas that do not participate in the analysis at all, the depiction of this residual class can be influenced. For example, a color can be assigned for area shadings, and a size 0 pt can be entered for symbol analysis to represent a symbol for areas whose value is outside the classification.
Data preparation for area based analyses
The following analyses are always area based, therefore no selection of the subtype is offered here:
- Area Coloring
- Boston Grid
Data-Driven Region Labeling
Each layer with area labels allows the display of data-dependent area labels in the section Area Labeling. Even if EasyMap does not present this type of data-dependent representation as an analysis, the data preparation corresponds to that of area based analyses. Therefore, an aggregation mode is required. Values for not analyzed areas are not displayed in the text output at all, whereas for empty table cells the value specified for Missing Data is used.
Here you can find out how to label areas or districts in a data-dependent way.
Location based representation
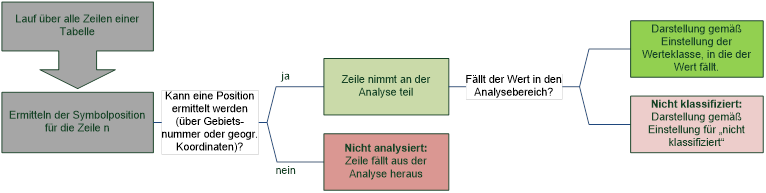
For location based analyses, the focus lies on a table, with an analysis output for each line of this table.
Data preparation for location based analyses
The following analyses are always location based, so no subtype selection is offered here either:
The analysis Area Hatching is a special case: although the representation is area based, there is no aggregation, just like location based analyses. Each data set is displayed as a hatching bar.
