
Adjusting colors, fills, patterns, and symbols
In many places colours can be set for different purposes. In addition to assigning colors via an analysis, you can also give each flat element its own color, transparency, hatching, gradient or pattern. In addition, EasyMap offers a range of ready-made symbols that you can use for analyses and location representations.
These settings are uniform everywhere and are therefore explained here in general.
color selection field
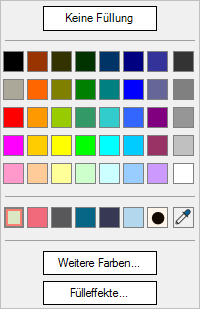
The color selection field allows you to select a color from a standard color palette. Below you have access to the last defined colors as well as to the Color Pipette. You can also set an element or area no fill or no color.
color pipette
With the color pipette ![]() you can pick up a color with one click from anywhere on the screen. The mouse cursor shows the mouse position, the captured color and the corresponding hexadecimal code.
you can pick up a color with one click from anywhere on the screen. The mouse cursor shows the mouse position, the captured color and the corresponding hexadecimal code.

Other colours
A click on the More Colors... button allows you to set your own colors by selecting Basic Colors or by selecting Custom Colors. Here you also have the possibility to determine the color via the settings hue, saturation and brightness or to enter an RGB color directly.
filling effects
The Fill Effects... button can be used to set a transparency or to set hatches, gradients and patterns for filling areas. You can also use this dialog to directly enter HTML color values.
With a simple filling, the surface is evenly coloured with the same colour. The Color can again be defined or reset via a color selection field. For the color you can set Transparency, either with the slider or a percentage.
You can also enter or read the color as HTML color value to paste the color e.g. from another setting or copy it for later use.
Note: If your object covers objects in the background that come from another layer, you can make the filling transparent to a certain percentage by setting the transparency. Please keep in mind, however, that a transparency of 100 does not display a background color.
|
Windows standard hatching pattern |
Here you have the option of setting a hatch for more than 50 different variants. This hatching usually draws very thin lines. |
|
Wide Hatching Pattern |
In contrast to the standard Windows hatching, this option allows you to determine the width of the drawn lines yourself. Four different hatching options are available. |
The colours for the hatching lines can be set again via the Colour selection field.
The Progression tab allows you not only to set a progression of two colors, but also to set the progression direction.
- In the Progression of area you can set the first color, directly below it you can even set a Transparency for this color.
- The Progression to allows the setting of another color.
- Alternatives - Here you can set one of the predefined progression variants or progression directions.
The image/pattern tab allows you not only to load files with pattern templates, but also to create your own patterns.
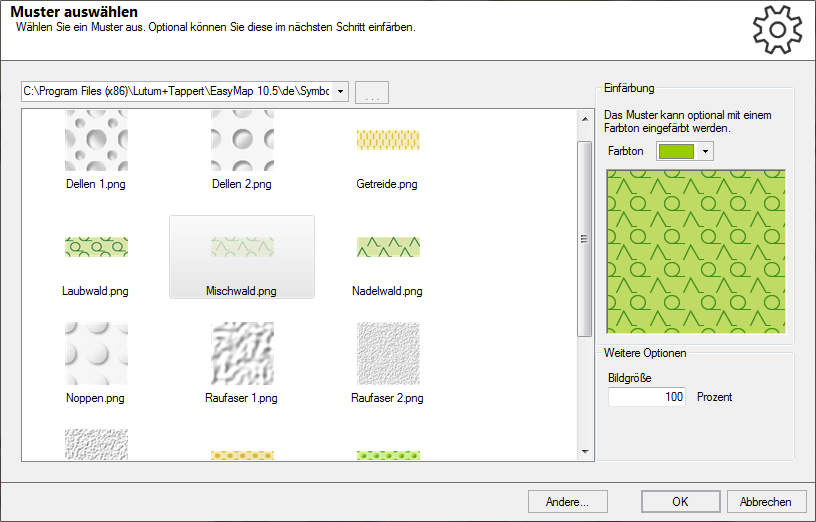
- A click on Select pattern... opens the standard directory of the pattern templates in the file format *.png. You are also welcome to use your own graphics for a sample. The pattern can be optionally colored with a color tone. This dialog offers you a preview of the (colored) pattern. Under More options you can change the image size in percent. This has an influence on how often the image is repeated in the pattern.
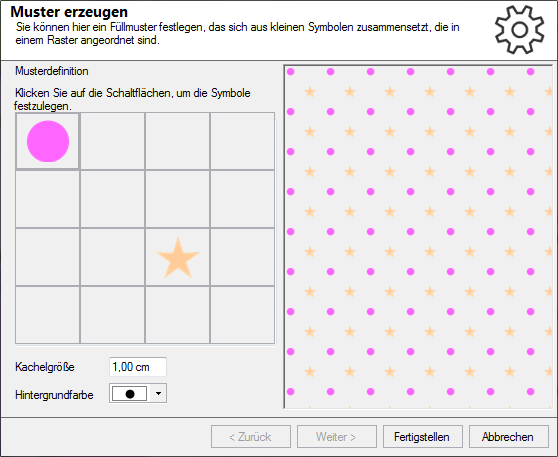
- A click on Create pattern... opens a dialog for creating your own patterns on a 4 x 4 matrix. Here you also have the option of either accessing existing symbols from EasyMap or using your own files.
A preview window always allows you to check the set pattern and change it if necessary. In addition to the color setting, you can always set Transparency of the preset patterns.
Saving and loading patterns
If you have designed a pattern, you can also save it so that you can use it in other workbooks.
- To do this, click Save... and specify the directory where your own pattern image file is to be stored.
- If you would like to use this texture again, you can do so directly by clicking on Select pattern > Other... Load again.
HTML color values
At many places in EasyMap colors can also be defined directly as text. This simplifies copying and pasting a color.
Often the corporate design of a company also defines colors in which logos, headings, etc. are to be displayed. In these cases, the correct color value will often be obtained in this form as well.
Note: Even if the following explanation of this color coding seems too complicated, you can use these color codes to "save" a color once found and reuse it in other places.
The coding takes place in a way of writing, as it can be found e.g. in web design or in many graphics programs. The character "#" is followed by a hexadecimal number with 6 or 8 digits (Sechszehnersystem: Numbers for the numbers 0-15 are used, where A=10, B=11, C=12, D=13, E=14 and F=15 are defined). This encodes the unique color value and optionally a transparency (transparency).
All colors on a computer can be clearly defined by a combination of red, green and blue. One also speaks of RGB color space. The share is determined by a number between 0 (=no share) and 255 (=full share). If transparency (often also called "alpha channel") is added, you get a ARGB color, which contains not only the color value, but also the transparency.
The coding lists these components one after the other for the transparency, the red value, the green value and the blue value. However, the parts are always given in hexadecimal notation, because here a part between 0 (#00) and 255 (#FF) can always be displayed with 2 characters. If the color is opaque, i.e. the "alpha" or transparency value is 255 or #FF, the transparency can be omitted and the number can only be 6 digits long.
Examples:
#FF0000 = full red, opaque
#88FF0000 = full red, semitransparent
#FFFF00 = full yellow, opaque
#888888 = medium grey
#000000 = black
#FFFFFF = white
#E20074 = "Telekom-Magenta" (The purple color, as it is binding for the corporate design of Deutsche Telekom AG)
Set transparency
In the analysis settings dialog it is possible not only to set different colors for individual elements (classes or symbols), but also to set transparency for all elements. Click on the Colors button in the analysis dialog and select Set Transparency.... You can then access the various tabs.
Symbol selection dialog
EasyMap offers the possibility to select symbols at symbol analyses, count diagrams and territory locations. To change the default symbol, call the Properties from the control window Contents of the respective symbol level or analysis. In addition to the Symbol property, a drop-down menu with a preselection of symbols is offered first.
Via the button More Symbols... you get to the symbol selection dialog, which grants access to all pre-installed symbols offered by EasyMap or offers you the possibility to load and edit your own graphic files.
Symbol:
- Select symbol...: Opens a file preview in which a new graphic file can be selected. The graphic formats GIF, JPG, JPEG, PNG, BMP, EMF, TIFF, SVG are supported.
- Embed Symbol File: Specifies whether a copy of the graphic should be saved in the workbook or whether the graphic should be read in again from the graphic file when the workbook is opened. Large graphics should not be embedded because they increase the size of the solution.
- Copy, Paste, Save: Allows you to edit the graphic in an editor and insert it later at this point to make modifications to existing graphics.
Consideration of the analysis colours:
- For symbol analyses, graphics must be displayed in different colors. EasyMap uses a system that depends on the graphic format.
- Allow custom colors: The analysis color is mixed into the graphic. Rather suitable for grayscale graphics or graphics that contain less saturated colors.
- Use Original Colors of the Image: The graphic is not colored. In this case, the analysis color is not taken into account.
Colorization of EMF and SVG files
For EMF and SVG files, a specific color in the original file (magenta, color value #FF00FF) is replaced by the analysis color. This color is not adjustable. If an EMF or SVG file is used that does not contain any components in this color, the analysis color will not be affected and all graphics will be displayed identically.
