
The EasyMap program window
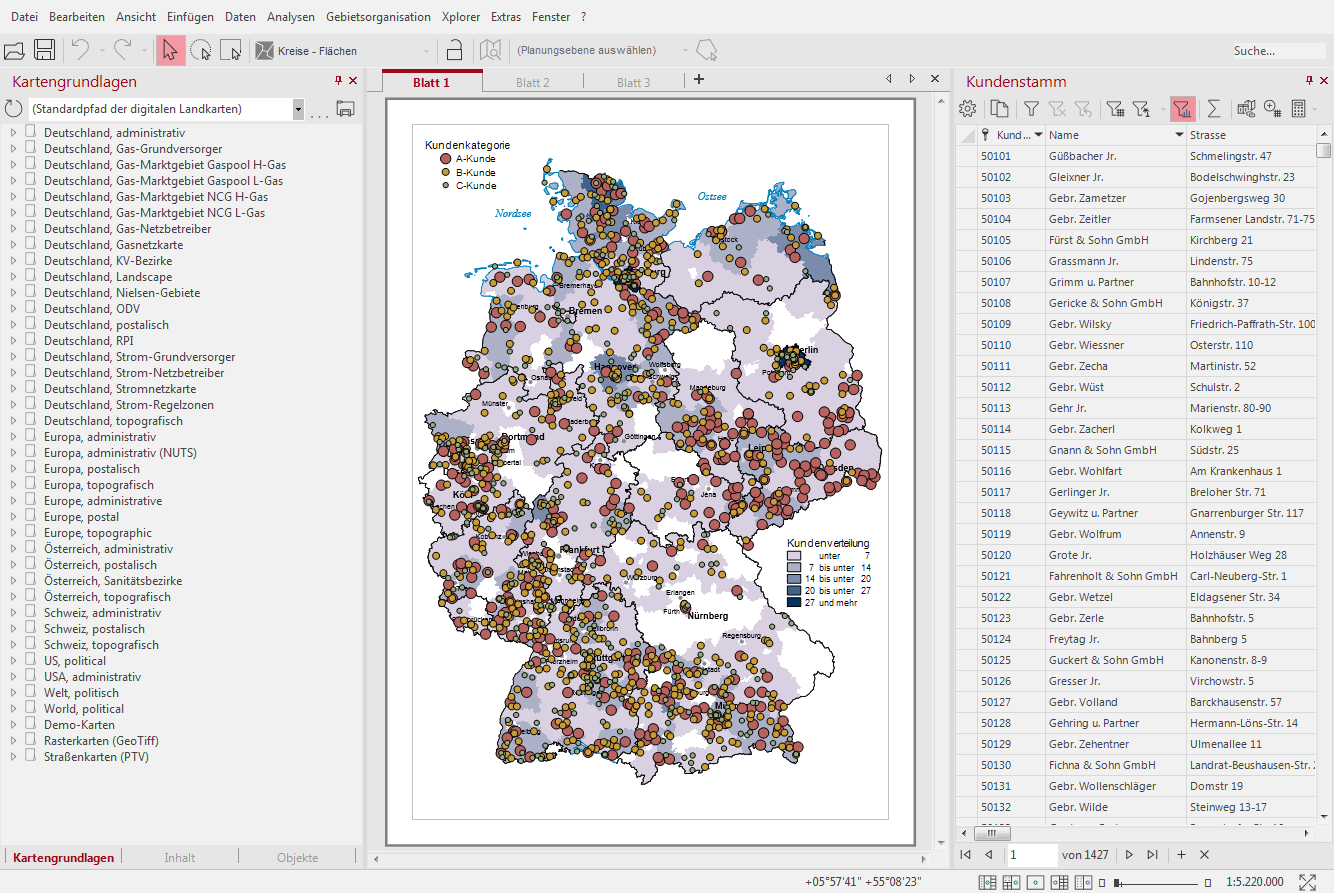
The EasyMap program window consists of the menu, a toolbar, the control windows, scrolling and map windows as well as one or more data windows.
Main menu
The main menu is displayed directly below the title bar and contains commands for opening the individual menus. More information on the meaning of the individual commands and functions can be found here.
The File menu summarizes all commands that refer to the entire workbook. It also contains commands to further process the workbook (expression, exports).
In the menu ? you will find access to our video tutorials and the example map folders. You can also find our Quick Start (Tutorial) here.
Toolbar
The toolbar below the main menu offers icon buttons for the most important commands in EasyMap. If you point to a symbol with the mouse without clicking on it, EasyMap shows which command is assigned to the symbol. Additional buttons can be added or removed as required. To do this, right-click the toolbar and select Customize... from the context menu.
A list of all symbol buttons and their meaning can be found here.
Control windows
In the EasyMap program window, the control windows are located on the left in the standard view. The control windows allow quick access to the individual functions. The user can open the control windows with the corresponding commands in the Window menu. To switch between the different control windows, click on the tabs at the bottom of the control windows.
More information on the individual control windows can be found here.
Map window
The EasyMap-workbook sheets are displayed in the map window in the middle or to the right of the control windows. A new workbook contains an empty sheet as well as the possibility to create additional sheets (the plus sign next to the sheet).
Which contents can be inserted into the map window can be found here.
Data window
Tables in EasyMap:
- After importing or linking external data and after creating an territory organization, EasyMap also opens a data window. This displays the external data.
- Imported data can also be changed, deleted and supplemented here; linked data cannot be edited in EasyMap, but only at the data source.
- Otherwise, the table offers different sortings and filters as well as a separate totals row, which can be switched between visible and invisible.
Status bar
The status bar is located at the bottom of the EasyMap screen.
- In the left part it informs about the processing progress (especially in case of extensive, longer lasting operations).
- Which object is currently selected is also indicated on the left.
- At the right edge it shows the coordinates of the current mouse position. If a sheet or an object that is part of a sheet is selected, the mouse position is displayed as the distance in cm from the upper left corner of the sheet. If a map or a level or an object within a map is marked, the mouse position is displayed in geographical coordinates.
- In addition, the status line shows the current view scale (if auto zoom is enabled) or the current map scale (if auto zoom is disabled).
- Here you will also find the selection of different arrangements of windows in DeepL access.
- The zoom slider allows you to zoom in or out directly on the sheet.
- You can precisely adjust the scale of your map by changing the scale or percentage, depending on the mark on the map or sheet, to the right of the zoom slider. To do this, click with the left mouse button on the percentage. A context menu opens with the possibility to enter the desired percentage or to change the map scale via the entry Setzen.... In addition, the functions View 1:1 like printout as well as the option to set the zoom directly to a mark made in the map are also located here.
- Click on the button
 rightmost in the status bar to get the complete view.
Full screen mode
In full screen mode, the screen is used to the maximum for the EasyMap map:
- The Windows taskbar disappears,
- the EasyMap program window is maximized,
- the map window is maximized, control and data windows are hidden,
- the menu bar and status bar are hidden,
- the toolbar contains only the icons for zooming and highlighting;
- the tabs for selecting the map sheets are retained.
The full screen mode is mainly used for presentation, as it does not offer any editing options. It is recommended to use auto zoom in conjunction with full screen mode. This allows you to ensure that EasyMap selects the map contents to be displayed according to the zoom level. Since data tables are hidden in full screen mode, we recommend using tooltips for analysis. If tooltips are activated, EasyMap shows the selected data when the mouse is moved over the map contents.
The full screen mode is activated with the corresponding command in the menu Window or with key F11. It can be deactivated by pressing F11 or Esc or by clicking Close in the toolbar.
