
Legends
Although the main message of a thematic map should essentially be understandable even without a legend, it is advisable to complete the map with legends and explanations (title, author, date, etc.).
All objects that EasyMap offers can be found in the Control window Objects. They can be added to the map from there via Drag&Drop or via the Insert menu.
Adding a Legend
All legends can be added to the map either via the Control Window Objects by Drag&Drop or via the Insert > Legend Elements menu.
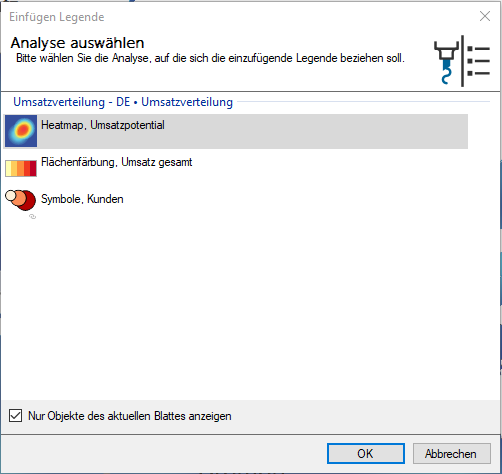
All legends can be added to the map either via the control window Objects via Drag&Drop or via the Insert > Legend elements menu. After inserting, a window opens in which all analyses of the current sheet matching the selected legend are displayed. If you want to insert a legend for an analysis on a different sheet, uncheck Display only objects of the current sheet. Afterwards you only need to select one analysis and the legend appears directly on the map sheet. This can be edited by double-clicking on the legend in the Properties menu.
Legend Elements
The legend should describe the map content completely and precisely. Different legend elements are available depending on the type of analysis. EasyMap lets you insert only those legend elements that match the existing analyses. The content of the legend is essentially determined by the settings for the corresponding analysis.
The following types of legends are available:
- Border Legends explain the different border representations within a map.
- Area Legends explain the different colourings of areas within a planar plane.
-
Analysis legends explain a design feature of an analysis, e.g. the color, size or symbol shape. Depending on the displayed design feature we distinguish between colour legends, size legends, symbol legends and combined symbol legends. In the latter case, several characteristics are displayed simultaneously.
-
A special case is the Histogramm, which also displays the frequency in addition to colors.
Note: Please note that by default legends are only visible if the corresponding analysis itself is visible. However, you may also display a legend for an unvisible analysis. To do this, simply tick the corresponding legend element box in the Content window (Always visible).
Note: When displaying the map folder in EasyMap Xplorer, note that legends are displayed differently in EasyMap Xplorer. Read more in the section display differences between EasyMap and EasyMap Xplorer.
The commands of the context menu
Besides the properties of a special legend, the legends can generally be edited in content control window or in the map via the context menu (right click). This offers some actions that can be performed on the legends.
| Transfer Selection to |
Transfers the current selection geographically to another object. Details... |
| Visible |
Shows whether the object is visible and allows switching the visibility. |
| Order |
Here you can change the selected element in the character sequence. Another option is to drag and drop the selected element within the content view. |
| Align |
Aligns several objects flush or aligns an object within its parent object. Details... |
| Refresh Layout |
Undoes all manual changes to this layer. |
| Map XY |
Here you will find various commands for the Map. |
| Copy |
Copy the object (if necessary with all subobjects) to the clipboard to paste it elsewhere. The object can be inserted in other applications as a graphic, or inserted in EasyMap as a copy of this object using the Insert command. |
| Paste |
Pastes the contents of the clipboard into this object as a child object. |
| Delete | Deletes the selected element. (See also: delete objects) |
|
Rename |
Changes the content view to an edit mode to give the object a new name. (This can also be achieved by clicking on an object that has already been marked.) |
| Properties... |
Opens a properties dialog in which you can edit the Properties of the selected object. If several objects are selected, many properties can also be changed simultaneously for these objects. |
