
Lines and connections
With this type of analysis, you can represent relationships between sites or areas or analyze linear geometries.
Lines
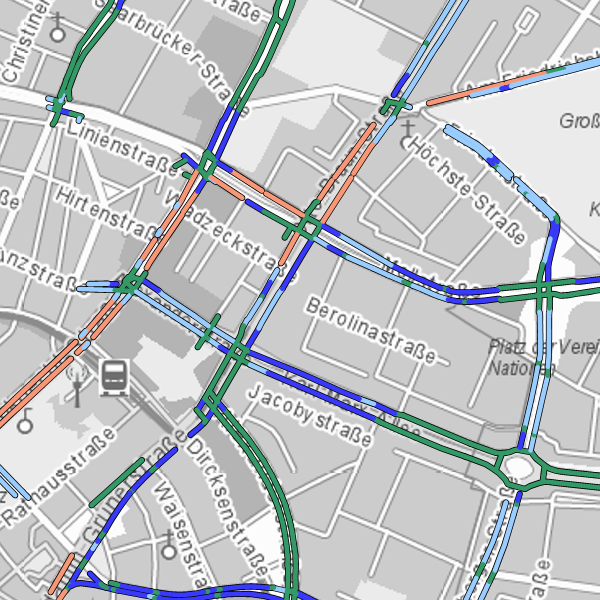
Line analyses behave similarly to surface colorations, except that linear objects can be analysed here. In addition to the color, the line width and the line style can be controlled data-dependently.
Relations
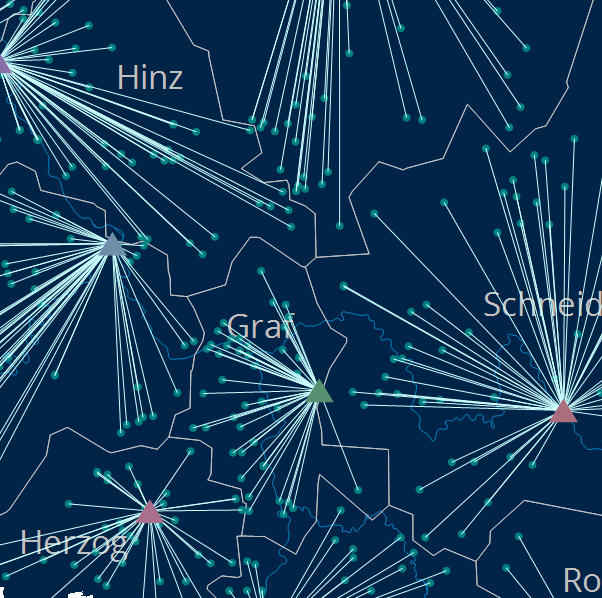
With Relation analyses EasyMap offers the possibility to display relations between areas or locations on the map (e.g. commuter relationships, migrations, flows of goods or purchasing power). A line or arrow is generated for each relation between two areas or locations.
