The Data Input for an Analysis
The dialog for selecting the Data input not only serves as a mere selection of the data for analysis, but also as a link between the data and the map layer in the map.
Depending on the analysis selected, you can choose between an Area based or a Location based analysis. This decision also influences the data evaluation:
- In the case of area based analyses, the data can only be linked via an area layer in the map. The data table must contain the appropriate area key for the corresponding level. With this type of display, the area is colored or a symbol or diagram is generated for each area on the map. If there are several data records for an area, they are grouped together.
- In case of a location-related representation, a symbol or diagram is placed on the map for each data set. easymap offers two different methods for placing the diagrams or symbols on the map : the placement via assignment to areas, the placement via geographical coordinates or placement via address. To change the placement method, click on the corresponding button.
Note: With all placement variants, the charts and symbols can only be moved if you have defined a primary key in your data. If this has not been done, you can click on the symbols but not move them!
Analysis reference Extended
For area-based and site-based analyses, you can determine the reference framework for the analysis. You can specify whether the analysis is to apply to all assigned areas or, in the case of a clip map, only to the selection in the clip map. By clicking on the button Advanced you can make this setting.
All assigned data
All data in the data basis that can be assigned to an area serves as the basic data for the analysis. In this case, a clip map acts only as a masking of the analysis result, but has no influence on the calculation of class boundaries or legends.
All data of the data basis that can be assigned to an area that is visible in the clip map serve as the basic data of the analysis. If no clip map is used, you get the same result as with the first option. However, if a clip map is set, the analysis only takes into account data belonging to the visible part of the clip map when creating the class boundaries.
This means that classifications and legends can change when the clip map changes.
Note: The clip map of the base level (for area-based analyses) or of the map (for site-based analyses) is always relevant for consideration. If a different clip map is used for the analysis itself, this has no influence on the data processing within the analysis and only acts as a mask.
Assignment Results
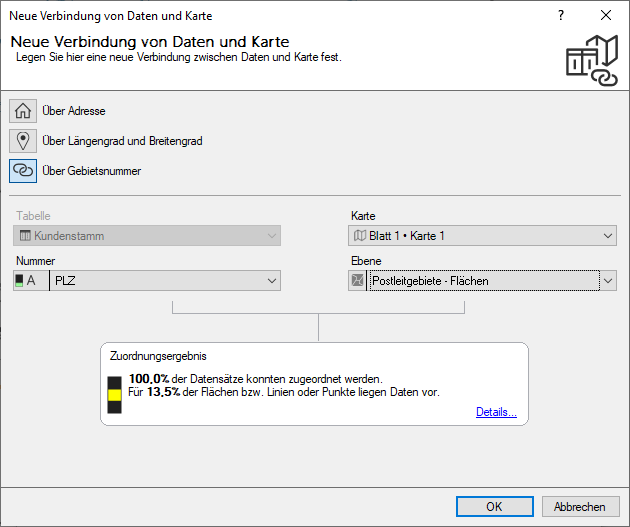
For area-related analyses as well as for location-related analyses in the variant placement via assignment to areas easymap checks which data records could be assigned to an area via the area number and which not. In addition, easymap checks to which territories data records could and could not be assigned. In the second step of the analysis wizard (data basis) easymap shows the assignment result in short form with percentages and traffic light display. The traffic light display serves as a rough orientation for the quality of the assignment. A green traffic light stands for a very good assignment result, yellow symbolizes a result that has defects, and red stands for a very poor result and should not be used.
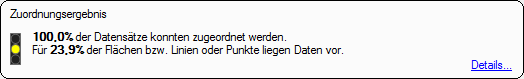
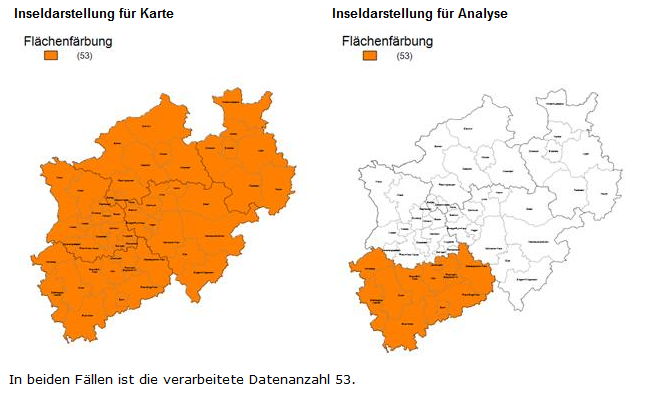
In the example shown, you can see that almost all data records could be correctly assigned (100.0%). However, data is only available for 23.9% of the areas. In concrete terms, this means that 23.9% of the areas could not be assigned to any data set. This can happen, for example, if not all areas are represented in the data basis.
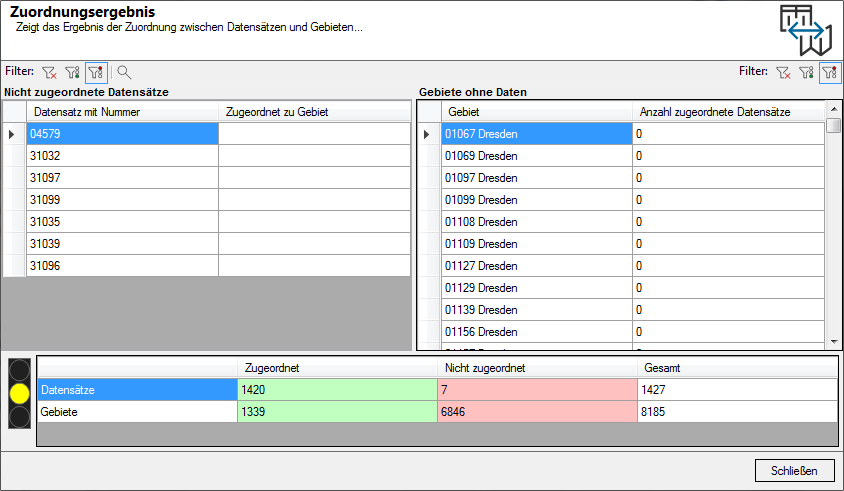
Detailed information on the assignment result can be obtained by clicking on Details... In the left column, area numbers from records not found on the map are displayed. The right column shows areas for which there are no matching records. This is mostly caused by data errors or differences between the actual state of data and map.
The tables for the data sets and areas can be further filtered using the respective Icons:

|
Displays all records or regions |

|
Filters according to assigned data records / Filters by areas with data |

|
Filters for unassigned records / Filters for areas without data |

|
Extends the (filtered) data records by further columns of the corresponding data table |
It is not possible to correct the corresponding key figures directly in the results table. In case of imported data, you can change them directly in easymap; you do not necessarily have to change the data at the source. Please note that the next time you import the data, the incorrect data records may still exist in the source file. In case of linked data records, you must make the corrections in the original data record and then update the table (via menu Data, command Update).
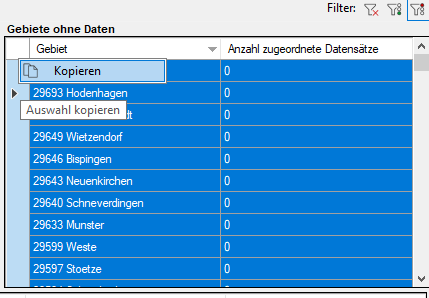
The list of data records that cannot be assigned (e.g. incorrect postcodes) and the areas for which data is missing can be copied to the clipboard and then pasted into other programs (e.g. Excel) for editing. To do this, activate the corresponding filter and select all entries (CTRL+A), then right-click in the table to copy the selection.
Call up assignment result
The assignment result can be opened in two ways:
- It is automatically displayed in the second step of the Analysis Wizard if the option Assignment by area number has been selected. The wizard can also be reopened by calling the Analysis Data Basics.
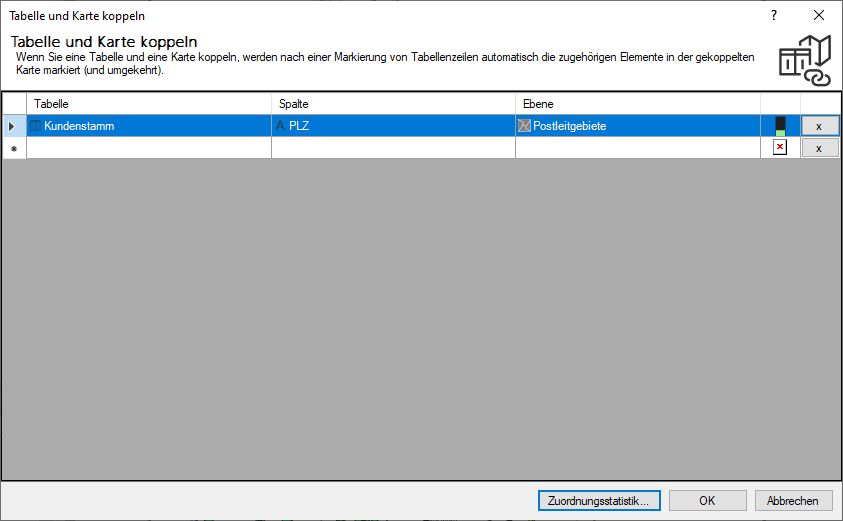
- The command Couple table and map is located in the menu Extras as well as at the symbol buttons in the tables themselves. Select the corresponding table here, click on Assignment statistics to open the Assignment result.