
Tooltip
Using Tooltips you can call up information about objects on the map when you move the mouse over them. This information can be a great help to identify the displayed symbols and surface analyses. It is an alternative to labeling the symbols, especially when space is limited, where the labels all overlap.
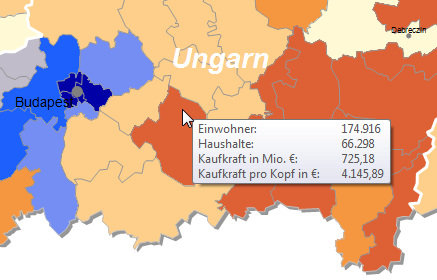
For analyses that generate symbols, charts or lines, the tooltip is displayed on these objects. For analyses that colorize areas, the tooltip is displayed on the corresponding area.
If you define a tooltip for several analyses and there are several objects that display a tooltip at the relevant point, the information is appended to each other.
Tooltips are available for all analyzes from the EasyMap Standard Edition, with the exception of the Raster analysis.
Composition of the tooltips
You can use any combination of fixed texts and variable text macros to create tooltips.
Depending on the type of display, you can use the data columns from the table that you selected for the analysis. For area based analyses, you can also use the standard labels of the respective area. The standard table (geography data) is not available for a location based analysis.
The tooltips are displayed according to your system settings for tooltips and cannot be edited any further.
How to insert tooltips for an analysis
The settings for tooltips can be found in the properties of the analysis in the Tooltip section.
The content of the tooltip is compiled in the input field User-Defined Labeling.
- After clicking on Insert Automatically... EasyMap makes a proposal of available data for tooltips to use.
- If you want to add more or other data in the tooltip, click on the button Text macros. Under data all columns of the underlying table are available. Simply click a column and it will be added to the text field of the user-defined labeling.
- In the case of area based analyses, such as area shading, you must determine how the data is summarized per area. Besides the total sum or count of data records, other aggregation modes are available.
- For area based analyses, you can also select area properties such as number and name under Text macros.
- Constant texts that should appear in each tooltip can be entered directly into the field under User-defined labeling.
- Set the option at Tooltip Enabled to No so that EasyMap does not show the tooltips. However, the definition of the tooltips remains unchanged. The tooltips can be reactivated at any time.
