
Area Shading
The task now is to colorize the individual territories according to the sales data imported in the previous step. The option Area Shading from the Analyze menu tab is suitable for this.
- Open the Data control window.
- From there, select the "Customer Base" table and the "Total Turnover" column.
- Use Drag&Drop to insert the column onto the map.
A new window will open. Choose a method of analysis, in this example - an Area Shading. Then set the assignment between table and map. EasyMap suggests assignment options. Select and assign the column PLZ2 to postal territories by selecting the option Territory number PLZ2 to Postal Territories - Areas.
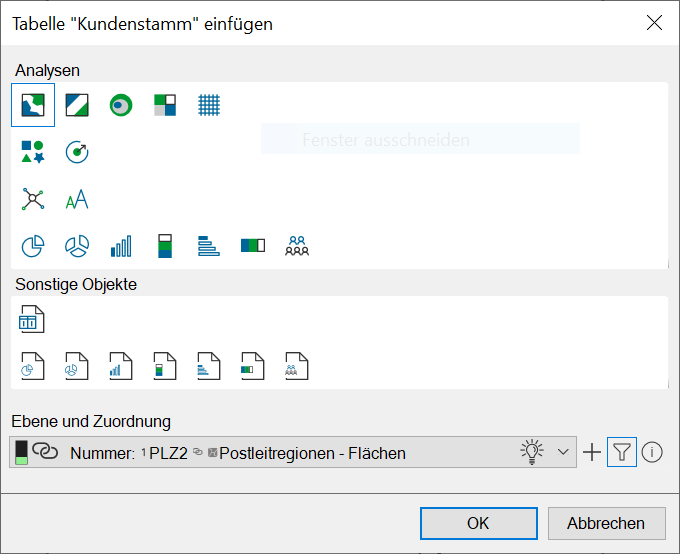
- Then click Ok.
EasyMap automatically inserts a finished Area Shading on the sheet and opens a Properties window on the right side of the program window. There you can make or adjust all further settings.
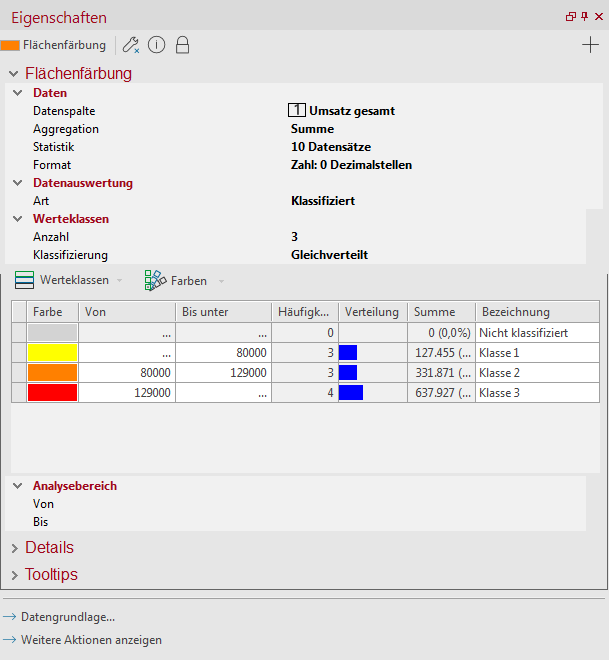
EasyMap immediately displays the Area Shading according to your settings on the map.
How to create an Area Shading in EasyMap is also explained in this video:
Continue with the next step - Display locations.
