
Visualize locations
You have the task of displaying the locations of customers on a map and identifying them according to an ABC classification. Since you only have the customer's postal codes, thus, the positioning and locations will be based on it.
First insert the 982 Postleitgebiete by Drag&Drop onto an empty sheet from the Base Maps control window.
To display the customer locations on the map, proceed as follows:
- Open the Data control window.
- Select the table "Customer Base" and the "Classification" column.
- Use Drag&Drop to insert the column onto the map.
Similar to Area Shading, the analysis window opens. This time, however, select the analysis Symbols . You will then be asked to specify the Analysis type .
- Select Location based as the analysis type.
The type of analysis determines how the data displays on the map. If you select Location-based analysis, then the data set from the table will each be represented by a point on the map.
Now place the assignment via the postal codes in the lower section. To open additional assignment windows, click the + sign next to the selection box.
In EasyMap, you can choose between three types of placement:
- By address
- via Geographic Coordinates or
- via Territory numbers.
If you select the Territory number, then specify which table contains the data, and on which sheet or in which map the data should display.
-
Data from table... = "Customer base"
-
...visualize in map = "Sheet 1/Map 1"
In the second row, the column with the area number is linked to the appropriate layer on the map. Choose here:
-
ID column = "Postcode"
-
Reference = "Postleitgebiete - Areas"
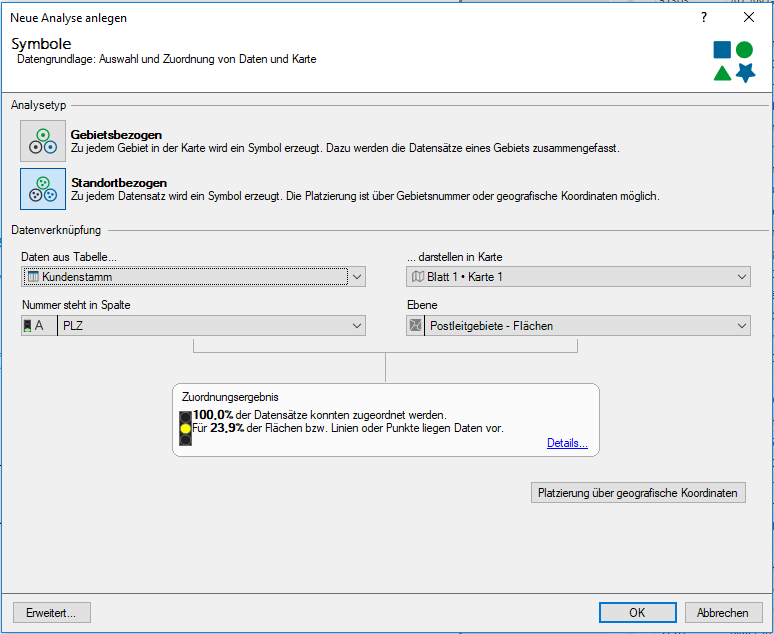
Under Result Allocation, the upper percentage value should be 100 %. It implies that all your data sets for an area could be assigned. On the contrary, a lower value indicates the percentage of your territories with existing data sets. Since, in most cases, a customer is not in every postal code. This value will, therefore, be correspondingly smaller.
Confirm your assignment with OK. Now check whether EasyMap has accepted the assignment correctly and then confirm with OK.
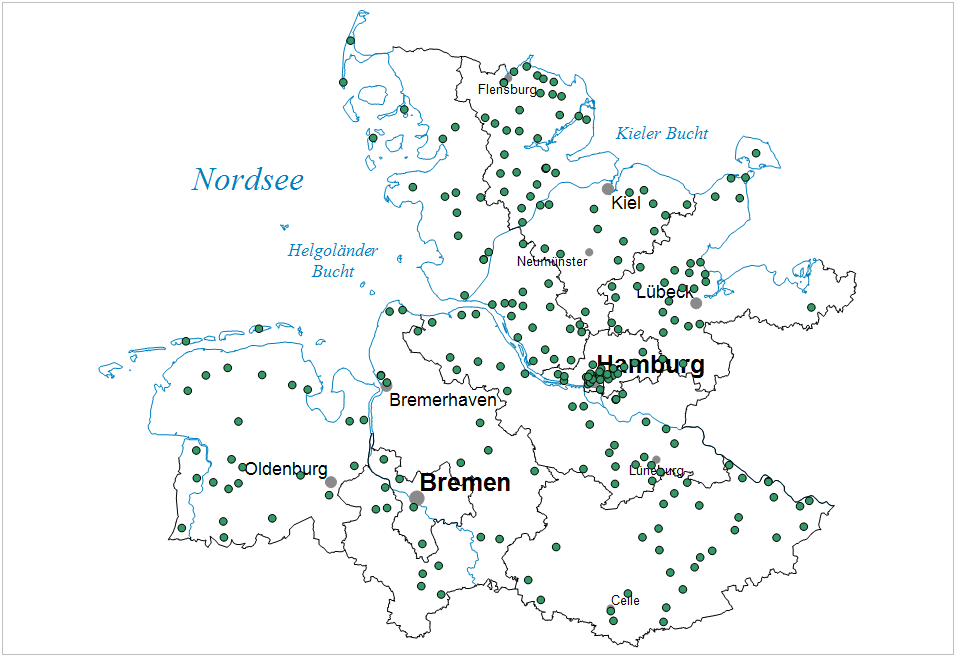
EasyMap automatically inserts points into the map and classifies them according to the selected column. At the same time, the Properties window of the analysis opens on the right. From the Properties, you can customize the settings.
The map should look like this:
Adapt analyses later
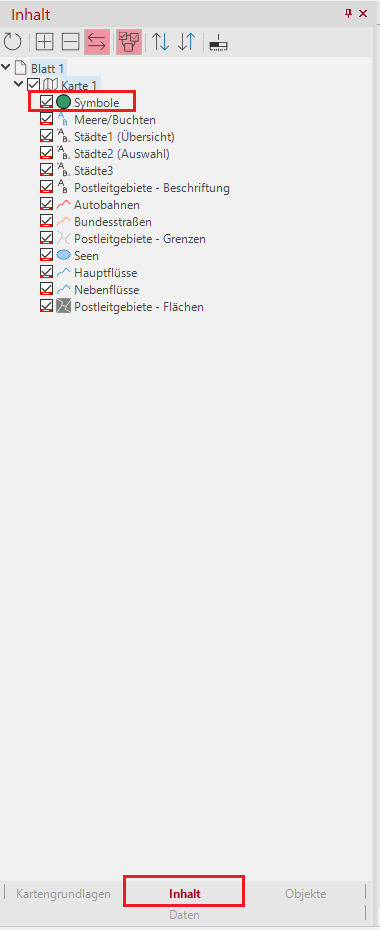
If you want to subsequently adjust the display of the points, double-click the Content control window to get to their Properties level of symbols:
To determine the qualitative differences between locations, you can evaluate the symbol, the color, and the size according to the data columns contained in the Customer Base table. You can display the size, for example, as a function of turnover and visualize the sales territory of the customer using various symbol forms. For more detail information, see the respective settings here and in the videos:
The analyses also operate in the same way with other territorial divisions, e.g. communities, districts or countries.
Continue with the next step - Sales Territory planning.
