
The Data Input for an Analysis
The dialog for selecting the Data input not only serves as a mere selection of the data for analysis, but also as a link between the data and the map layer in the map.
Depending on the analysis selected, you can choose between an area based or a location based analysis. This decision also influences the data evaluation:
- In the case of area based analyses, the data can only be linked via an area layer in the map. The data table must contain the appropriate area key for the corresponding level. With this type of display, the area is colored or a symbol or diagram is generated for each area on the map. If there are several data records for an area, they are grouped together.
- In the case of a location based representation, a symbol or diagram is placed on the map for each data set. EasyMap offers two different methods for placing diagrams or symbols on the map: Place data by assigning it to areas or Place data using geographic coordinates. To change the placement method, click on the corresponding button.
Note: For both placement options, the diagrams and symbols can only be moved if you have defined a Primary key in your data. If this has not been done, you can click on the symbols but you cannot move them!
Selection and assignment of data and map
Placement via assignment to areas
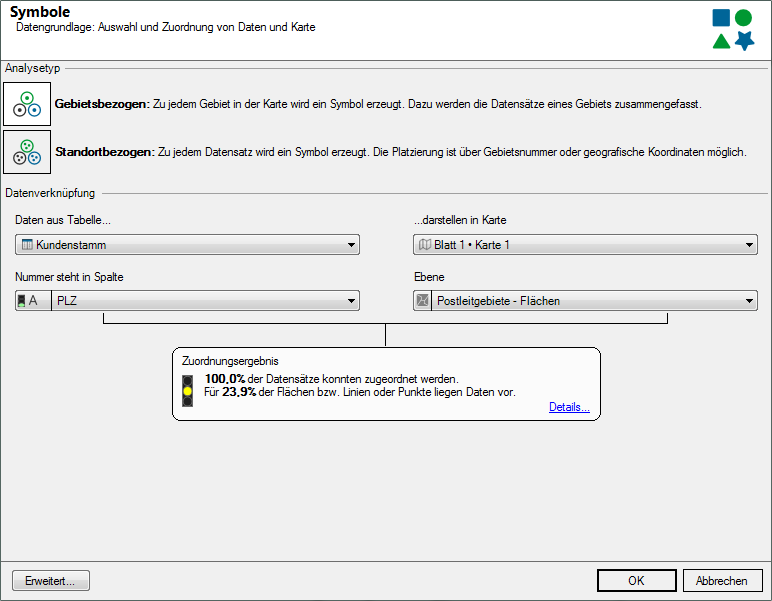
In case of placing data by assignig it to areas, analyses can be carried out for area based as well as for location based. For most area analyses (e.g. area coloring or Bostin Grid only this option is offered. With this option, there must be a column with the area number in the data basis, which must then be selected in this dialog and assigned to the appropriate map layer.
- First, choose Data from table... and select the table that contains the data to be displayed in the analysis.
- To the right at ..display in map you define on which sheet and in which map the data should be displayed.
- In the second line under Number you will find in column select the column with the area key to the matching Level on the right. The area number is used to assign the individual data records to the corresponding area.
The symbols or diagrams are placed at the position of the area label when you place them by assigning them to areas. Thus, the symbol is normally located within the reference area.
Place data using geographic coordinates
The placement with geographic coordinates allows exact placement of symbols and diagrams on the map. The coordinates must be included in your data. EasyMap does not calculate these coordinates!
If the coordinates are not available as geographic coordinates, the coordinates must be at least compatible with the coordinate system of the map. In this case, you can use the EasyMap function Coordinate Transformation to convert them into geographical coordinates.
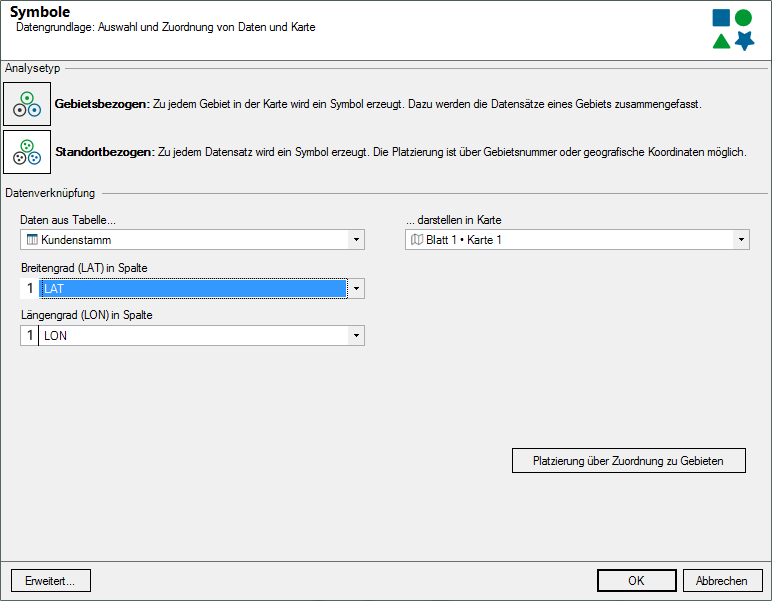
In order to read the coordinates, 2 columns, one for Latitude (LAT) and one for Longitude (LON) are needed. In addition, the coordinates should be formatted as decimal degrees with point as separator. Special characters such as the degree character or apostrophe cannot be processed.
Example:
| Latitude (LAT) | Longitude (LON) |
| 50.7049 | 7.147 |
Analysis reference Extended
For area and location based analyses you can determine the reference for the analysis. You can specify whether the analysis is conducted for all assigned areas or, in the case of a clip map, only for the selection in the clip map. Click on the Advanced button to make these settings.
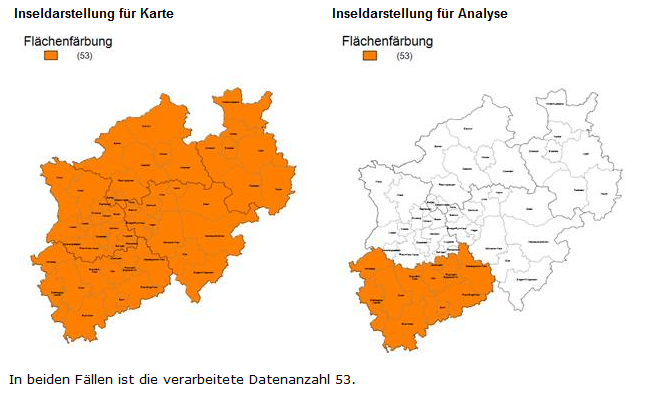
All data in the data basis that can be assigned to an area serves as the basic data for the analysis. In this case, a clip map acts only as a masking of the analysis result, but has no influence on the calculation of class boundaries or legends.
All data of the data basis that can be assigned to an area that is visible in the clip map serve as the basic data of the analysis. If no clip map is used, you get the same result as with the first option. However, if a clip map is set, the analysis only takes into account data belonging to the visible part of the clip map when creating the class boundaries.
This means that classifications and legends can change when the clip map changes.
Note: The clip map of the base level (for area-based analyses) or of the map (for site-based analyses) is always relevant for consideration. If a different clip map is used for the analysis itself, this has no influence on the data processing within the analysis and only acts as a mask.
Assignment Results
In the case of area based analyses and location based analyses (variant Place data by assigning it to areas). EasyMap checks which data records have (not) been assigned to an area using the area code. In addition, EasyMap checks which areas have (not) assigned data. EasyMap shows the assignment result in the second step of the analysis wizard (Data input) in short form as percentage and as traffic light depiction.

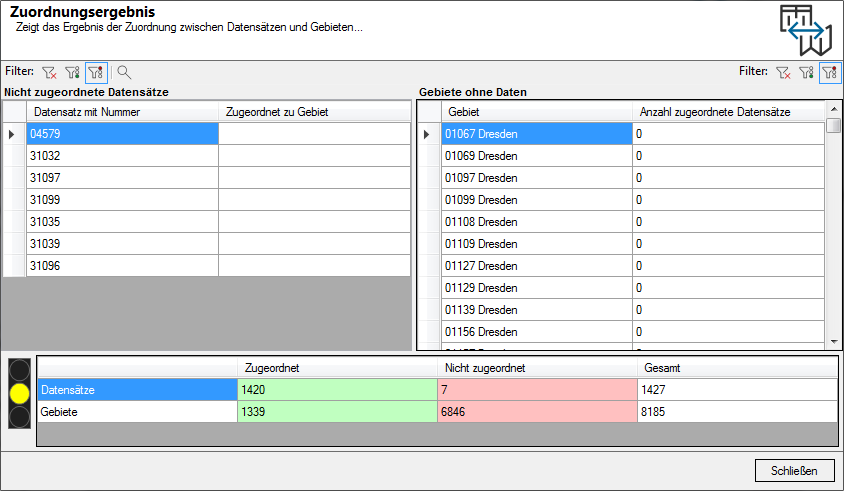
The example shows that almost all data sets could be assigned correctly (99.9%). However, only 16.4% of the areas have data available. Click on Details... to get detailed information on the assignment result. In the left column, area numbers from data sets that were not found in the map are displayed. The right column shows areas for which there are no matching data sets. This is usually caused by data errors or differences between the current state of the data and the map.
A direct correction is not possible in the results table. For imported data, you can alter them directly in EasyMap, so you do not have to change the data source. Please note that the incorrect data records may still be present in the source file the next time you import the data. For linked datasets, you need to make corrections in the original dataset and then update the table (menu Data, command Update).
The list of unassigned data sets (e.g. incorrect postal codes) and the areas for which data is missing can be copied to the clipboard and pasted from there into other programs (e.g. Excel) (see command Copy in the context menu).
