
EasyMap 11.1
The following new features are available in the new EasyMap version:
- New license management minimizes installation and administration effort
- More flexibility when creating analyses
- Always the right color - the new color pipette
- Further improvements in user guidance
- Area assignments of lists and intervals are supported.
- Quick search and find - result list is displayed
- Insert Internet maps conveniently
- Get information about the base map with one click
- Keep the overview - Mouseover in the table of contents
- Create and use templates - get there faster
- Newsfeed - always be up to date
- Using SVG files as symbols and graphics
- Automatically generate the overall view for area and filter reports
- New video series
- Further innovations
New license management
With the new license management, setting up EasyMap and updating software and maps has never been easier. Instead of a license file, you now receive a license key that communicates with our license server. Your advantages:
- base maps and base updates can now be installed directly from EasyMap. You will receive the latest base maps quickly and easily.
- No more searching for the right license file: Your license key will remain unchanged in the future. For example, if you have received a new EasyMap version within the scope of your service subscription, you do not need to reactivate your license. In addition, you no longer need to confirm the EasyMap download, but can use your license key directly.
- The license activation wizard has been greatly simplified, making it easy to set up EasyMap.
- A concurrent user check now takes place automatically. There is no need for an IT administrator to set it up.
Note: To activate the license and start EasyMap, an Internet connection is required to access the license server. Further information about the installation can be found here.
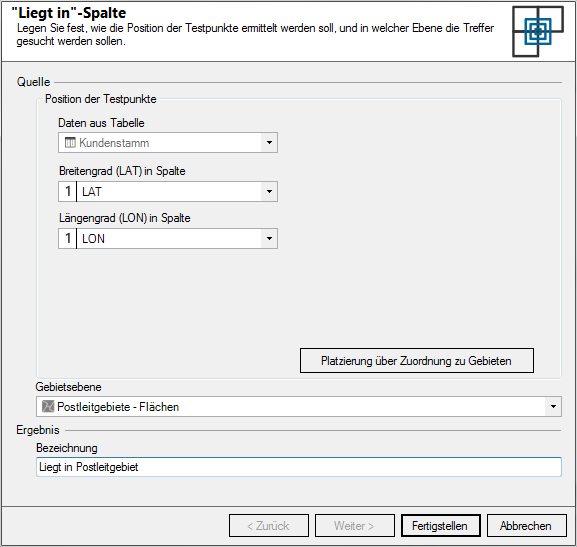
More flexibility when creating analyses
You couldn't decide right away what type of analysis you wanted to create? Uniform, simple or differentiated? We take that decision off your hands. The creation of an analysis now only consists of a dialog: Selection of the data table and the analysis type.
Example: You want to see customer locations on the map. You select from the menu Analysis the Icons. Then you have to choose between - one symbol per customer ( site-specific) or one symbol per area ( site-specific) - as well as select a table with customer data and connect it to the map. With a click on Ok, the customers are displayed on the map by default with uniform symbols. The innovation in EasyMap 11.1: You can still decide after whether and how the values of the symbols (color, form and size) of data columns of your customer table should be controlled. It is up to you to have the representation of the symbols influenced by up to three data columns. You can use the symbol, size and color option to link... to control the symbol display from a single column (previously: simple analysis type).
Instructions on how to add locations to the map are available here.
Always the right color - the new color pipette
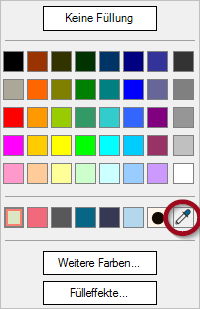
You need a certain colour for a surface colouring or a colour from the corporate design of your company, but don't have the hexadecimal code at hand? EasyMap 11.1 now has a color pipette integrated in all color selection menus, e.g. fill color, text color, shadow color or border color. So with just one click on the color from anywhere on the screen, you can capture the color directly into the color field.
Further improvements in user guidance
For the last release we have made many improvements to the user interface and the operation of EasyMap. EasyMap has become more modern, more intuitive and clearer. We continue to work on this and notice through the intensive contact to our users, where there are still some problems with the operation. We have now optimized the new property dialogs so that you immediately know where and how you can change settings. Also the calculation dialogs, which you can reach e.g. via the Fx button in the tables, have been revised and are easier to use.
Area assignments of lists and intervals are supported.
You do not have the exact 5-digit postal code assignments for the sales area, but work with postal code intervals? EasyMap 11.1 can now read and process these lists.
Example: You have an assignment table of sales representatives and the postal codes assigned to them. However, the postal codes are not assigned to the employees individually, but are in a comma-separated table and are available in intervals from postal code - to postal code.
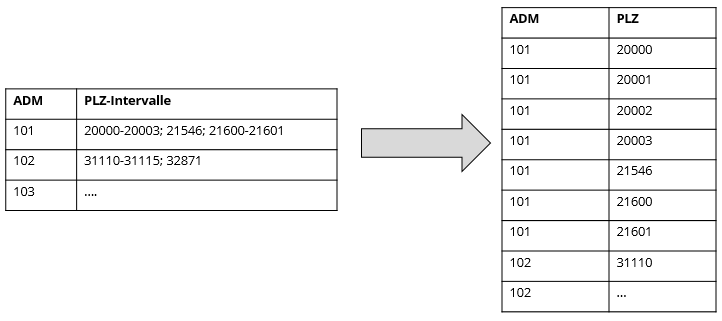
The new function Collect list converts the assignment of postal code intervals to ADM into a form that can be used for EasyMap.
Where do you find the innovation?
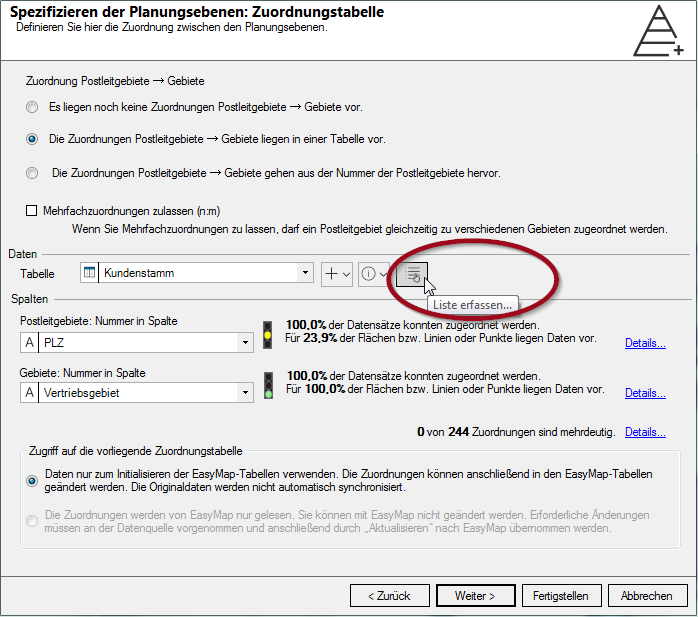
When you create a new territory structure, you will find the new option Create list in step Specify planning levels: Assignment table (see adjacent figure).
In the new dialog Create assignment list an assignment with enumerations (";") can be created. ", " "+" "[tab]" etc.) intervals ("-", "...", "bis") and wildmaps (* and ?) can be converted into an assignment table with standard structure. More information can be found here.
Insert Internet maps conveniently
So far you have inserted Internet maps via the menu Insert or control window Objects. Since, for example, road maps are indispensable especially for small-scale analyses, you can now also find them in your other base maps. Internet Maps for Germany, for example, you are in the Germany folder, Background Maps > Internet Map Services. Further, standard Internet maps are available in the folders Austria, Background maps and Europe, Background maps. 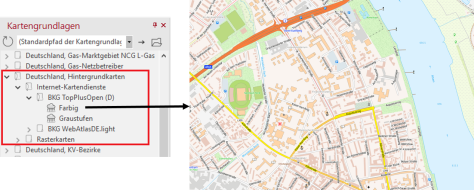
Get information about the base map with one click
For each base map (LTG) you will receive an Excel spreadsheet with important information about the base map. This table can now be easily retrieved via the control window base maps. Click with the right mouse button on the desired map layer and then on More Information. The appropriate table then opens. The information contained therein may vary depending on the base map. For the postal code areas, it contains, among other things, the assignment to the postal code for home delivery and a history of changes to the postal code areas. In this table you will always find the names and numbers of all areas of the respective base map.
Quick search and find - result list is displayed
The search field in EasyMap 11.1 now displays a result list. It contains all hits from all map layers and provides a small preview. This allows you to select individual elements directly and find them even faster.
Keep the overview - Mouseover in the table of contents
If you move the mouse pointer over the map elements in the control window Content, they will be highlighted in the map window. With this optical innovation you can orientate yourself better and keep track of several maps, objects or legends on one sheet.
Create and use templates - get there faster
Do you mostly use certain base maps? Have you already invested a lot of time in the design of the layout? Or would you like to standardize the design of your maps? Then it is advisable to design workbookn as templates and reuse them for new evaluations.
In the menu File you will find the command Save as template. Give the new template a suitable name and then click Save. If you want to use a saved template, click on File in the menu New and select one of the templates listed there. You can also reach your templates comfortably via the welcome window at the start of EasyMap.
Newsfeed - always be up to date
The EasyMap welcome window informs you about all important news. No matter if EasyMap updates, offers, event information or user tips - you will be one of the first to know the latest information and interesting articles about geomarketing.
New designs for the scale object
Known in previous versions as the "KM Scale", the object is now called Scale and offers you new designs and greater freedom for customization. The Scale can be found in the control window Objects in the area Geography.
Using SVG files as symbols and graphics
Symbols and graphics now also support SVG files (Scalable Vector Graphics). This makes it even easier for you to use your own graphics for symbol analyses, counting diagrams or territory locations. SVG is a widely used vector format that allows resizing without significant loss of quality.
Note that the original SVG file must contain the color magenta (color value #FF00FF) if the graphic is to be displayed according to the analysis color. If an SVG file is used that does not contain any components in this color, the analysis color has no effect; all graphics are displayed identically.
For information on how to use symbols and graphics, see here.
Automatically generate the overall view for area and filter reports
You create a area report of your territory and want to create a sheet for the overall view? You are using a Filterreport for A-, B- and C-customers, but you also want to export a map with all customers? Previously, you had to export the report and the overall view separately. You now have the option of including such an overall view when you create the report or in the report properties. For the area report, set the check mark for Control in the area Include overall view. In the filter report, you set the following in the area Filter definition Include unfiltered view on Yes.
New video series
Learn EasyMap easily with our new video tutorials. You can view them directly on the support portal or visit our Youtube channel for more exciting videos from the field of geomarketing.
Further innovations
- Outlying territory locations are considered for clip mapen.
- The alignment of territory labels is adjustable - see Change properties.
- New Example maps - for even more ideas of your own map projects.
- The anchor point of objects is now always top left.
- Legends can use uniform analysis representations.
